I have produced a more complex approximation for moon phase that does not require the inverse tangent function. It is empirical, that is, there is no one-to-one relationship with a physical model ( at least not one I am aware of  ). It was produced by taking the simple model and adding sine waves to it ( I ended up with three ). The initial choice of amplitude, frequency and phase was made by looking at the error curve for the simple model ( versus the next 20 years of moon phase data from the USNO site ) and trying to fit sine waves to it. This was followed by a tedious process in EXCEL of solving for each variable over and over again until all variables converged.
Anyway, here is the formula:=
Moon Phase:
"(((#DNOW#-583084344)/2551442802)+0.005843543sin(((#DNOW#-583084344)/5022920569)+3.23423)+0.0175542sin(((#DNOW#-583084344)/378924049))-0.003826534sin(((#DNOW#-583084344)/437400425)+2.99521)-
floor(((#DNOW#-583084344)/2551442802)+0.005843543sin(((#DNOW#-583084344)/5022920569)+3.23423)+0.0175542sin(((#DNOW#-583084344)/378924049))-0.003826534sin(((#DNOW#-583084344)/437400425)+2.99521)))
"
The output is a number that continuously increases between 0 and 1;
where:
0 => new moon,
0.25 =>1st qtr,
0.5 => full,
0.75 => 3rd qtr.
Note that the actual meat of the formula is only half of the above, the rest is needed to convert the “lunation” number ( in the form of say, 680.2723 ) to the phase ( 0.2723 ).
…
For comparison, the equivalent simple equation is:
“(((#DNOW#-583084344)/2551442802)-floor(((#DNOW#-583084344)/2551442802)))”
…
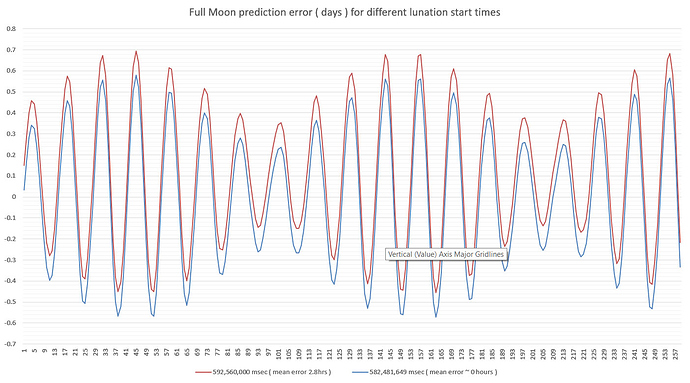
Now, how do they compare …
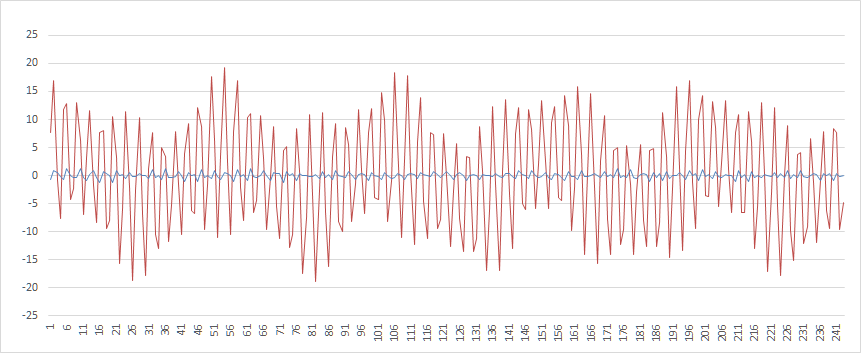
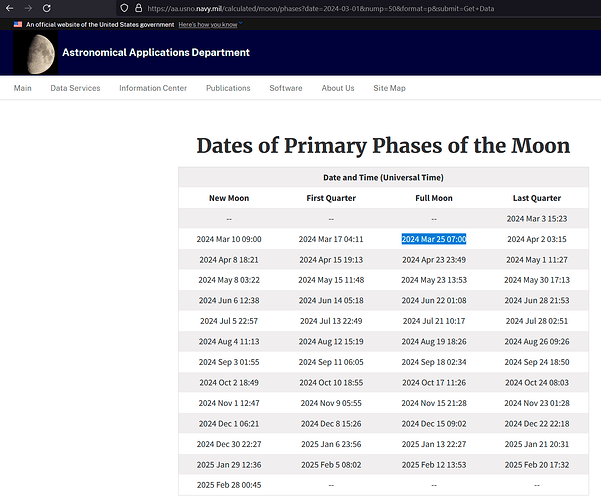
The graph shows the error ( in hours ) between the predictions from the models and the “true” phase at that time. The “true” phase data comes from the US Naval Observatory site. { note that the analysis is only based on data for new moon, 1st qtr, full moon and 3rd qtr as I could not find a source for reliable intermediate phases - the upshot of this is that the errors between the phases is unknown for both models. }
The red curve is the error for the simple model and the blue for the complex.
In terms of numbers:
Simple model:
Max error: 19.32 hours
Average magnitude of error: 8.15 hours
Complex model:
Max error: 1.28 hours
Average magnitude of error: 0.36 hours
Both have a total average error of zero. ( That is, half the time the error is negative and half the time positive without a constant offset. )
The difference between the models is, I believe, not significant for the purpose of displaying a moon phase image - the visual difference of the moon over a number of hours as viewed on a small watch is not great.
However, for the purpose of showing moon orbiting around the face of a watch, the difference becomes more significant as one places the moon further from the centre of rotation. At the watch edge the difference will, at times, be noticeable. How noticeable will depend on the particular implementation.


 ). It was produced by taking the simple model and adding sine waves to it ( I ended up with three ). The initial choice of amplitude, frequency and phase was made by looking at the error curve for the simple model ( versus the next 20 years of moon phase data from the USNO site ) and trying to fit sine waves to it. This was followed by a tedious process in EXCEL of solving for each variable over and over again until all variables converged.

 It is very important to have and know the “tables of the Ephemerides”


