[TOMAJA Tutorial] Temperature Line Chart - Weather Forecast Diagram

In the Facer Creator there is not possible to connect directly two points with a simple line at the moment (December 2017). Therefore, I was trying to draw a line between point A and B using the Width and Rotation functions of a standard Line Object. However, I was not able to realize is successfully in the whole range of changed angle between points. This problem is described here.

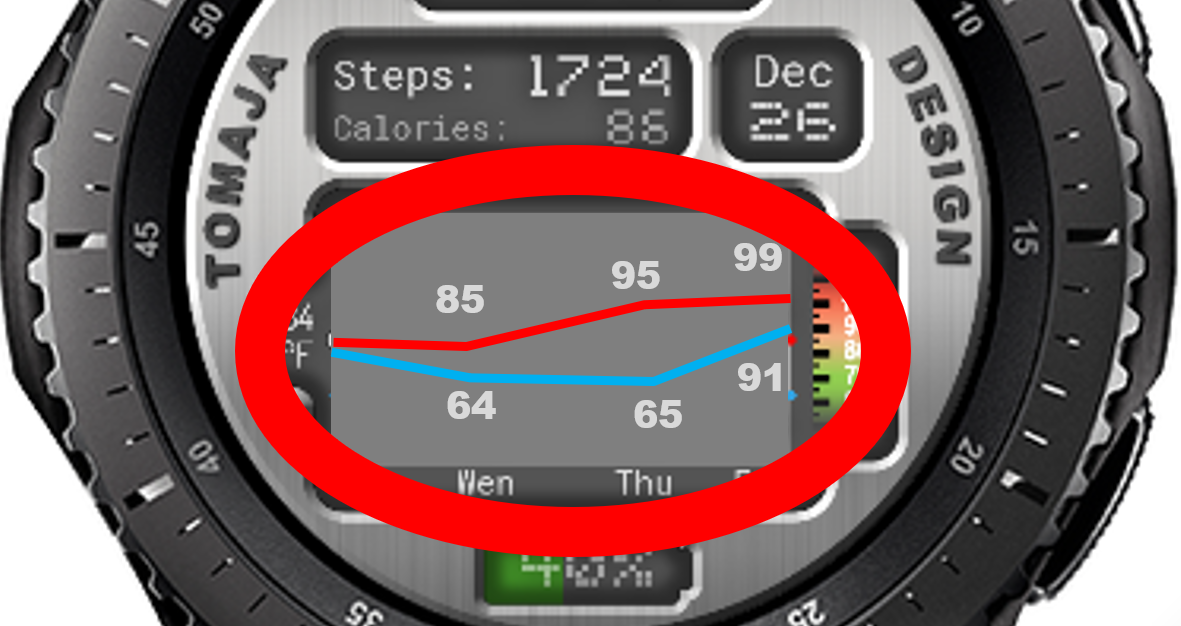
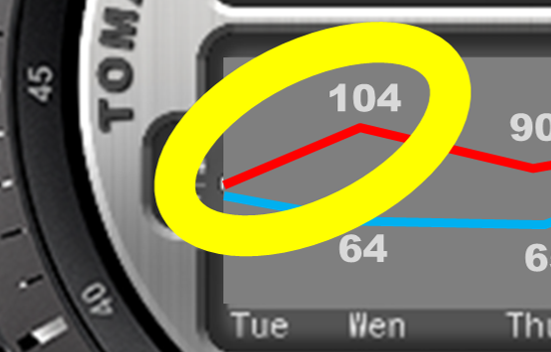
In this tutorial another method for drawing lines between points (up to the angle of app. 45 degree with the same X-axis distance) is described. Example of a temperature forecast line diagram at a watch face:

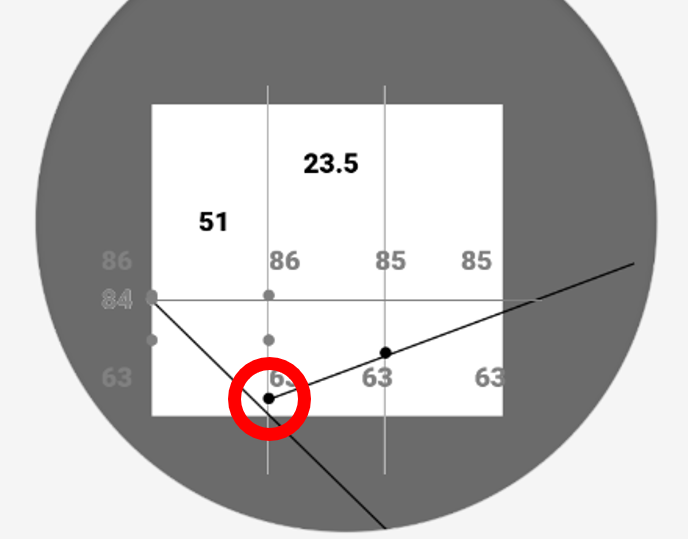
Correlation between the points distance in the Y-axis and Rotation was observed in the first line:

The distance in the Y-axis is shown with the black number. In the following table an example of correlation is presented:

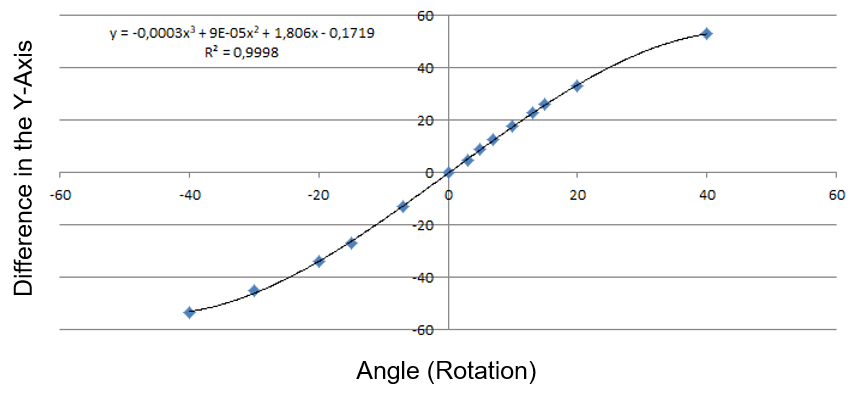
It would be possible to cover almost whole range of the points position. However for a simplicity I was using only a line correlation. The disadvantage of this solution is an inaccurate connection between two points at higher distances.

The probability of such high angles at the outside temperature is low:

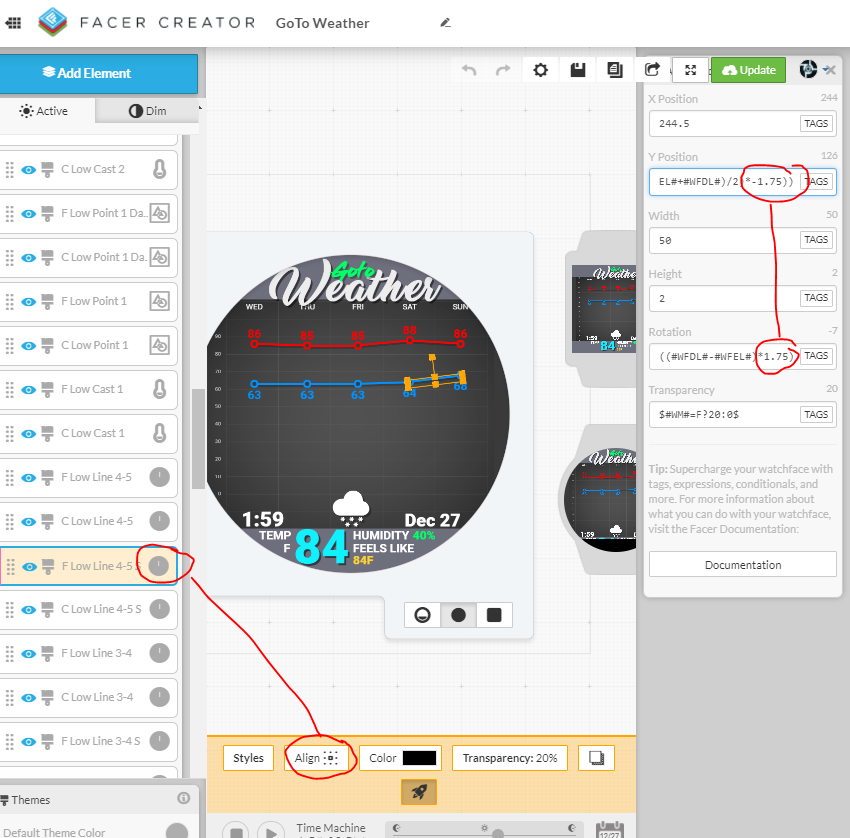
Therefore the simple line correlation was used at this Temperature Line Chart. Example of the first ā€œred lineā€:

Y-Axis: (200+(#WCT# - #WTH#))

Rotation: (#WTH# - #WFAH#)

To have a dynamic scale with the current temperature always in the middle (ā€œ200ā€ is the starting point - current temperature) all lines are connected (calculated) according to the current temperature. Great advantage of this solution is a system which is working in Fahrenheit and Celsius parallel.

Here are all dynamic parameters (expressions) for lines for a 3 days forecast:
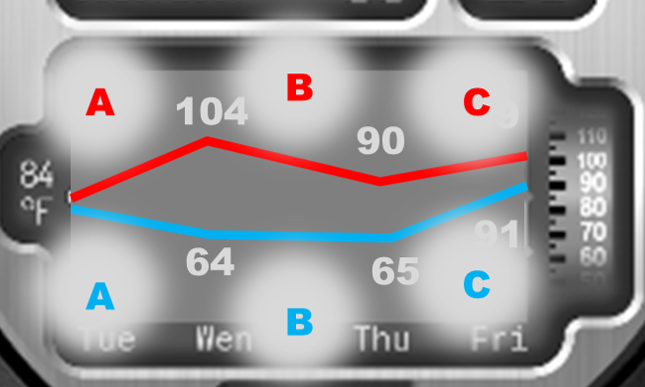
Redline A
X-axis: 60
Y-axis: (200+(#WCT#-#WTH#))
Rotation: (#WTH#-#WFAH#)

Redline B
X: 120
Y: (200+(#WCT#-#WFAH#))
R: (#WFAH#-#WFBH#)

Redline C
X: 240
Y: (200+(#WCT#-#WFBH#))
R: (#WFBH#-#WFCH#)

Blueline A
X-axis: 60
Y-axis:(200+(#WCT#-#WTL#))
Rotation: (#WTL#-#WFAL#)

Blueline B
X: 120
Y: (200+(#WCT#-#WFAL#))
R: (#WFAL#-#WFBL#)

Blueline C
X: 240
Y: (200+(#WCT#-#WFBL#))
R: (#WFBL#-#WFCL#)

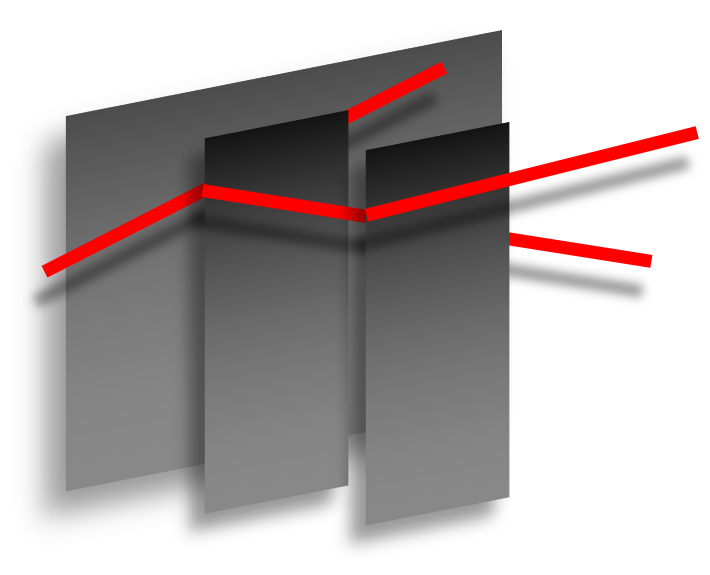
The (length) width of lines is not consider in this examples due to another technique how to cut the line (hiding the line behind an rectangle object with the same color as the background) at the proper point in this way:

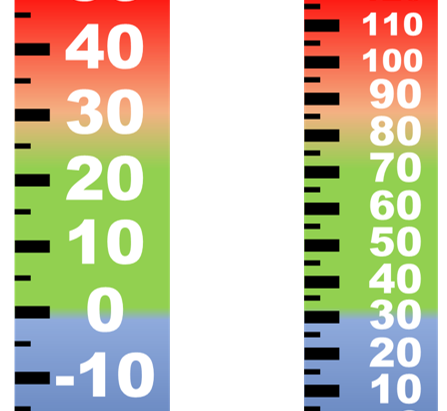
The only one element to change due to the temperature unit is the scale:

If you are interesting in, you could inspect the example watch face in detail at the inspection mode here: www.facer.io/watchface/HvsmViVEXU/inspect

Watch to sync:

Definitely neat approach. I did a little different method for my bar chart. I came up with averages and then rotated based on the center point between the different forecasted days.

I went ahead and enabled inspection on mine if you want to compare.

1 Like

If you want to get really fancy, check out the math on the ā€œHeat Index/Feels Likeā€. Unfortunately itā€™s not terribly useful in December, unless you live in Australia.

Hello @eradicator09 , this is the watch face I was inspired with :slight_smile: thanks for the inspection mode - excellent job. I tried your ā€œengineā€ with extreme values and its well the same effect. However, to rotate lines in the middle helps a lot with minimizing the ā€œgapā€. Yours are only the half on mines :+1:

Maybe we will get a proper instrument for dawing lines soon :slight_smile:

Did you even tried to calculate the angle with a sin function? It is still my problem.

ā€¦are you speaking about this? :fearful:

Source: Heat index - Wikipedia

Did somebody already used it for a watch face here at facer?

Hi Thomas, sorry for being honest, I hate the design of your watchface, it has poor typography, and look like a neo-futurist thing from the 60ā€™sā€¦ Other than that, youā€™re a genius for making this tut. Thanks a lot!

Hi @elv3n12! you are so right with the design description :slight_smile: . Letā€™s take this watch face as an expample how bad the final result could be, if a designer is strongly focused (only) on the funcionality of one ā€œtechnical featureā€ā€¦ (I am working on a the next watch face with the integrated temperature forecast chart right now - however I am so lazy to move the chart position that it could be a disaster watch face no. 2) Anyway I would be happy if you comment it honest again :wink:

1 Like

Yeah, thatā€™s the one. I have a tutorial on the calculation for it ready to go. Fun stuff.

On the lines, all mine uses simple math. I leave all the heavy stuff to @Mellin. The way it worked for me was cheating by using a dial element. I think I chose seconds or minutes, then uploaded a simple png for the ā€œhandā€. This allowed me to fix the mid point as a rotation center. From there the simple average was calculated, then a ratio added to the rotation to adjust for the height of the graph.
Keeping the graph fixed also simplified things. This meant a simple conversion ratio can be used for any change in value.

For determining length of the line, I cheated again by only utilizing a fixed width. The round ball points effectively cover the overshoot I built into each line. There is about 16 pixels worth of excess that are normally hidden behind the points. With the graph being fixed, only temperature swings in excess of 20-30 degrees would ā€œbreakā€ the effect and show that the lines donā€™t reach. Although Iā€™m sure if you wanted to be extra anal you could develop a formula to increase its size based on the temperature variance between each day.

All that said, using the center point of the hand dial is what ended up being the factor for me. I think the original image was a simple 2x2 pixel square. You can always change the size in the creator to create a line effect.

Thanks for additional explanation. What I saw is in the inspection mode is your perfect description of every element you use - and there are manyā€¦

I appreciate your humility and open-mindedness. Very nice.

Thanks guys for the above discussion & tutorial. I had actually worked much of the graph out prior to finding this tutorial, but it was instrumental in drawing lines between data points. So I really appreciate this thread! Currently I can only confirm that it works in Celsius, and if data points get far above the 5 day average high/low, things can get a bit wonky, but so far generally work. The scale isnā€™t fixed but rather dependent upon the 5 day average high and the 5 day average low. The idea was to show the trends & hopefully I was able to modern the graph up a bit.

To avoid some wonky results, Iā€™ve been tweaking the expressions for joining the lines between the data points to use Pythagoreans theorem. For instance the width of the line between day 1 high and day 2 high can be re-written as:
sqrt(30*30+((210+((50*(((#WFAH#+#WFBH#+#WFCH#+#WFDH#+#WFEH#)/5)-#WFAH#))/(((#WFAH#+#WFBH#+#WFCH#+#WFDH#+#WFEH#)/5)-((#WFAL#+#WFBL#+#WFCL#+#WFDL#+#WFEL#)/5)))))-(210+((50*(((#WFAH#+#WFBH#+#WFCH#+#WFDH#+#WFEH#)/5)-#WFBH#))/(((#WFAH#+#WFBH#+#WFCH#+#WFDH#+#WFEH#)/5)-((#WFAL#+#WFBL#+#WFCL#+#WFDL#+#WFEL#)/5))))))*((50*(((#WFAH#+#WFBH#+#WFCH#+#WFDH#+#WFEH#)/5)-#WFAH#))/(((#WFAH#+#WFBH#+#WFCH#+#WFDH#+#WFEH#)/5)-((#WFAL#+#WFBL#+#WFCL#+#WFDL#+#WFEL#)/5)))))-(210+((50*(((#WFAH#+#WFBH#+#WFCH#+#WFDH#+#WFEH#)/5)-#WFBH#))/(((#WFAH#+#WFBH#+#WFCH#+#WFDH#+#WFEH#)/5)-((#WFAL#+#WFBL#+#WFCL#+#WFDL#+#WFEL#)/5)))))))

And the rotational value using simple tan theta=(opposite/hypotenuse) can be re-written as:
tan(((210+((50*(((#WFAH#+#WFBH#+#WFCH#+#WFDH#+#WFEH#)/5)-#WFAH#))/(((#WFAH#+#WFBH#+#WFCH#+#WFDH#+#WFEH#)/5)-((#WFAL#+#WFBL#+#WFCL#+#WFDL#+#WFEL#)/5)))))-(210+((50*(((#WFAH#+#WFBH#+#WFCH#+#WFDH#+#WFEH#)/5)-#WFBH#))/(((#WFAH#+#WFBH#+#WFCH#+#WFDH#+#WFEH#)/5)-((#WFAL#+#WFBL#+#WFCL#+#WFDL#+#WFEL#)/5))))))/30)

The values that come up on the creator look reasonable, and graphically it seems to work. But I canā€™t seem to save or send to the watch when I use these longer expressions. Is there a limit?

I donā€™t think there is a limit. Iā€™ve had longer expressions than that.
What you really need to get the lines and dots to match is inverted tan (atan),
which is not supported on WearOs watches (so it seems).

Fortunately someone made an expression to get an approximate value and it works well:

In this example you can see how I made the length of the line stay between the 2 points and in the center of the dots:

The red line is using atan (and does not work on a WearOs watch), the turquoise line is using the atan expression from the post I added. These lines are linked to battery percentage for testing purposes (inspect is on)

(I added the yellow line linked to current minute, so it also moves when viewing in preview)

Thank you very much @ThaMattie for this very informative explanation. You put a lot of effort into this reply and I appreciate it. Very useful example too, thank you for opening up inspection mode.

I canā€™t beleive I didnā€™t think of using aTan(x) instead of Tan(x). I guess itā€™s been 35 years for me since high school - ha ha! Iā€™m now getting into this aTan expression & with your explanation above I think I can crack it! :slight_smile:

By the way I solved the above large expression for the length of line (the hypotenuse & Width in Creator) by breaking down the expression into a simplified algebraic version of itself:
((30**2+((50*(#WFAH#-#WFBH#))/( ((#WFAH#+#WFBH#+#WFCH#+#WFDH#+#WFEH#)/5) - ((#WFAL#+#WFBL#+#WFCL#+#WFDL#+#WFEL#)/5) ))**2)**0.5)
It works quite wellā€¦

1 Like

Thanks again @ThaMattie for your input. I was able to crack the rotation expressions code. Turned out to be a fairly long expression, but it works, it saves, it syncā€™s to the watch. :+1:

(deg((((pi*(((50*(#WFAH#-#WFBH#))/(((#WFAH#+#WFBH#+#WFCH#+#WFDH#+#WFEH#)/5)-((#WFAL#+#WFBL#+#WFCL#+#WFDL#+#WFEL#)/5)))/30)*(0.596227+(((50*(#WFAH#-#WFBH#))/(((#WFAH#+#WFBH#+#WFCH#+#WFDH#+#WFEH#)/5)-((#WFAL#+#WFBL#+#WFCL#+#WFDL#+#WFEL#)/5)))/30)))/(2*(((50*(#WFAH#-#WFBH#))/(((#WFAH#+#WFBH#+#WFCH#+#WFDH#+#WFEH#)/5)-((#WFAL#+#WFBL#+#WFCL#+#WFDL#+#WFEL#)/5)))/30)*(1.192454+(((50*(#WFAH#-#WFBH#))/(((#WFAH#+#WFBH#+#WFCH#+#WFDH#+#WFEH#)/5)-((#WFAL#+#WFBL#+#WFCL#+#WFDL#+#WFEL#)/5)))/30))+2)-(pi*(0.596227-(((50*(#WFAH#-#WFBH#))/(((#WFAH#+#WFBH#+#WFCH#+#WFDH#+#WFEH#)/5)-((#WFAL#+#WFBL#+#WFCL#+#WFDL#+#WFEL#)/5)))/30))*(((50*(#WFAH#-#WFBH#))/(((#WFAH#+#WFBH#+#WFCH#+#WFDH#+#WFEH#)/5)-((#WFAL#+#WFBL#+#WFCL#+#WFDL#+#WFEL#)/5)))/30))/(2*((((50*(#WFAH#-#WFBH#))/(((#WFAH#+#WFBH#+#WFCH#+#WFDH#+#WFEH#)/5)-((#WFAL#+#WFBL#+#WFCL#+#WFDL#+#WFEL#)/5)))/30)-1.192454)*(((50*(#WFAH#-#WFBH#))/(((#WFAH#+#WFBH#+#WFCH#+#WFDH#+#WFEH#)/5)-((#WFAL#+#WFBL#+#WFCL#+#WFDL#+#WFEL#)/5)))/30)+2))*(1+abs((((50*(#WFAH#-#WFBH#))/(((#WFAH#+#WFBH#+#WFCH#+#WFDH#+#WFEH#)/5)-((#WFAL#+#WFBL#+#WFCL#+#WFDL#+#WFEL#)/5)))/30))/(((50*(#WFAH#-#WFBH#))/(((#WFAH#+#WFBH#+#WFCH#+#WFDH#+#WFEH#)/5)-((#WFAL#+#WFBL#+#WFCL#+#WFDL#+#WFEL#)/5)))/30)))/2+(pi*(0.596227-(((50*(#WFAH#-#WFBH#))/(((#WFAH#+#WFBH#+#WFCH#+#WFDH#+#WFEH#)/5)-((#WFAL#+#WFBL#+#WFCL#+#WFDL#+#WFEL#)/5)))/30))*(((50*(#WFAH#-#WFBH#))/(((#WFAH#+#WFBH#+#WFCH#+#WFDH#+#WFEH#)/5)-((#WFAL#+#WFBL#+#WFCL#+#WFDL#+#WFEL#)/5)))/30))/(2*((((50*(#WFAH#-#WFBH#))/(((#WFAH#+#WFBH#+#WFCH#+#WFDH#+#WFEH#)/5)-((#WFAL#+#WFBL#+#WFCL#+#WFDL#+#WFEL#)/5)))/30)-1.192454)*(((50*(#WFAH#-#WFBH#))/(((#WFAH#+#WFBH#+#WFCH#+#WFDH#+#WFEH#)/5)-((#WFAL#+#WFBL#+#WFCL#+#WFDL#+#WFEL#)/5)))/30)+2)))

Now Iā€™ve got a proper length of line with pythagorean theorem and a proper rotation using atan(x). Such a relief to have accurate math and no more wonky charts due to over simplifying things.

I was able to update my weather trend watchface above, and my Earthshade Weather Trend one below. Awesome!

Good to see it all worked out!

Now that we are in colder temperatures, I have found that Facer messes up the values of things when subtracting negative temperature tags. Say for instance if you are working with:
(#WFAH#-#WFBH#)
You will find if the value of #WFBH# is negative, it wonā€™t correctly do the math. You have to re-write the expression to:
(#WFAH#-(#WFBH#))
and then it will work. Weird, and mathematically no different, but it fixes the errors I have been getting when forecasted temperatures are -1C and lower.

Due to this, I have to re-write all my expressions in about 8 watch faces I have published - darn! For those curious and wanting an update, the updated expressions are as follows:

Y coordinate for Day 1 High:
((210+((50*(((#WFAH#+#WFBH#+#WFCH#+#WFDH#+#WFEH#)/5)-(#WFAH#))) / (((#WFAH#+#WFBH#+#WFCH#+#WFDH#+#WFEH#)/5)-((#WFAL#+#WFBL#+#WFCL#+#WFDL#+#WFEL#)/5)))))

Width of line from Day 1 to Day 2 (based on 30 pixels between data points):
((30**2+((50*(#WFAH#-(#WFBH#)))/( ((#WFAH#+#WFBH#+#WFCH#+#WFDH#+#WFEH#)/5) - ((#WFAL#+#WFBL#+#WFCL#+#WFDL#+#WFEL#)/5) ))**2)**0.5)

Rotation of line from Day 1 to Day 2 (based on 30 pixels between data points):
(deg((((pi*(((50*(#WFAH#-(#WFBH#)))/(((#WFAH#+#WFBH#+#WFCH#+#WFDH#+#WFEH#)/5)-((#WFAL#+#WFBL#+#WFCL#+#WFDL#+#WFEL#)/5)))/30)*(0.596227+(((50*(#WFAH#-(#WFBH#)))/(((#WFAH#+#WFBH#+#WFCH#+#WFDH#+#WFEH#)/5)-((#WFAL#+#WFBL#+#WFCL#+#WFDL#+#WFEL#)/5)))/30)))/(2*(((50*(#WFAH#-(#WFBH#)))/(((#WFAH#+#WFBH#+#WFCH#+#WFDH#+#WFEH#)/5)-((#WFAL#+#WFBL#+#WFCL#+#WFDL#+#WFEL#)/5)))/30)*(1.192454+(((50*(#WFAH#-(#WFBH#)))/(((#WFAH#+#WFBH#+#WFCH#+#WFDH#+#WFEH#)/5)-((#WFAL#+#WFBL#+#WFCL#+#WFDL#+#WFEL#)/5)))/30))+2)-(pi*(0.596227-(((50*(#WFAH#-(#WFBH#)))/(((#WFAH#+#WFBH#+#WFCH#+#WFDH#+#WFEH#)/5)-((#WFAL#+#WFBL#+#WFCL#+#WFDL#+#WFEL#)/5)))/30))*(((50*(#WFAH#-(#WFBH#)))/(((#WFAH#+#WFBH#+#WFCH#+#WFDH#+#WFEH#)/5)-((#WFAL#+#WFBL#+#WFCL#+#WFDL#+#WFEL#)/5)))/30))/(2*((((50*(#WFAH#-(#WFBH#)))/(((#WFAH#+#WFBH#+#WFCH#+#WFDH#+#WFEH#)/5)-((#WFAL#+#WFBL#+#WFCL#+#WFDL#+#WFEL#)/5)))/30)-1.192454)*(((50*(#WFAH#-(#WFBH#)))/(((#WFAH#+#WFBH#+#WFCH#+#WFDH#+#WFEH#)/5)-((#WFAL#+#WFBL#+#WFCL#+#WFDL#+#WFEL#)/5)))/30)+2))*(1+abs((((50*(#WFAH#-(#WFBH#)))/(((#WFAH#+#WFBH#+#WFCH#+#WFDH#+#WFEH#)/5)-((#WFAL#+#WFBL#+#WFCL#+#WFDL#+#WFEL#)/5)))/30))/(((50*(#WFAH#-(#WFBH#)))/(((#WFAH#+#WFBH#+#WFCH#+#WFDH#+#WFEH#)/5)-((#WFAL#+#WFBL#+#WFCL#+#WFDL#+#WFEL#)/5)))/30)))/2+(pi*(0.596227-(((50*(#WFAH#-(#WFBH#)))/(((#WFAH#+#WFBH#+#WFCH#+#WFDH#+#WFEH#)/5)-((#WFAL#+#WFBL#+#WFCL#+#WFDL#+#WFEL#)/5)))/30))*(((50*(#WFAH#-(#WFBH#)))/(((#WFAH#+#WFBH#+#WFCH#+#WFDH#+#WFEH#)/5)-((#WFAL#+#WFBL#+#WFCL#+#WFDL#+#WFEL#)/5)))/30))/(2*((((50*(#WFAH#-(#WFBH#)))/(((#WFAH#+#WFBH#+#WFCH#+#WFDH#+#WFEH#)/5)-((#WFAL#+#WFBL#+#WFCL#+#WFDL#+#WFEL#)/5)))/30)-1.192454)*(((50*(#WFAH#-(#WFBH#)))/(((#WFAH#+#WFBH#+#WFCH#+#WFDH#+#WFEH#)/5)-((#WFAL#+#WFBL#+#WFCL#+#WFDL#+#WFEL#)/5)))/30)+2)))

Update: All weather trend watch faces in my collection have been updated now. Sure wish Facer had a way to push these updates or advise all the users of the update, since there are lots of themā€¦ ĀÆ_(惄)_/ĀÆ

4 Likes

Astonishing. I thought the Formulas for Rotating the Moon were HD. I cannot Imaging how you come up with this level of Maths. Respect to you and the others in the community who help those like myself who struggle with HD.

1 Like

I donā€™t think anyone really watches this old tutorial, but in case someone does, the recent (not so recent anymore) WearOS changes to Facer killed the weather graphing lines with zero slope. It hasnā€™t been much of a priority to me to fix this as I still use my old Tizen Galaxy watch, which still works fine. Nonetheless, I have poked around with working on a fix now and then, and finally have it now. Thank you @russellcresser for the testing. Any way, the fix is in the line rotation field, as the old rotation field generated a NiL value which WearOS didnā€™t like. The new fix adds a conditional to clear this issue. The updated sample of daily high graph line rotation value from Day1 to Day2 is:

$(#WFAH#-#WFBH#)==0?0:((#WFAH#-#WFBH#)/abs(#WFAH#-#WFBH#)(deg(acos(30/((30**2+((50(#WFAH#-#WFBH#))/( ((#WFAH#+#WFBH#+#WFCH#+#WFDH#+#WFEH#)/5) - ((#WFAL#+#WFBL#+#WFCL#+#WFDL#+#WFEL#)/5) ))**2)**0.5)))))$

Iā€™ve got over 100 watch faces that this needs to be implemented on. Several have been updated, but many more to go. If a user wished a specific update, Iā€™ll get on it right away. Otherwise iā€™ll eventually get to them all.

3 Likes

Imagine all the Faces that will never get Updated . I found one I used Glow on the other day . I think the Face has a couple of dozen syncs .Self respect makes you sort them out :::)))

2 Likes